Urinary protein profile changes in diabetic rats and pre-diabetic rats fed with high-fat diets
DOI:
https://doi.org/10.15419/bmrat.v7i1.586Keywords:
diabetes, pre-diabetes, high fat diet, metformin treatment, urinary protein profileAbstract
Background: Type 2 Diabetes is the most common form of diabetes mellitus, accounting for 90% of all types of diabetes. Diet is one of the important factors affecting the progression of the disease.
Methods: In this study, we used urinary protein profile to evaluate the progression of pre-diabetic to diabetic state. Urinary protein profile of pre-diabetic rats with various diet conditions and with or without metformin treatment were compared to those of healthy rats and diabetic rats.
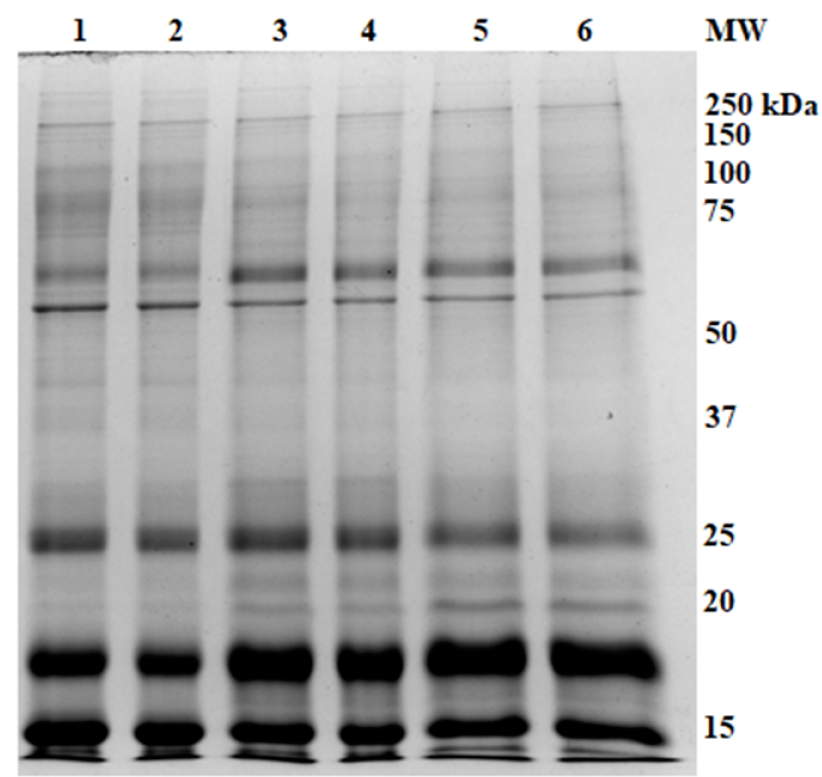
Results: It was shown that there were distinct bands that could differentiate the healthy rats from the diabetic ones, namely the protein bands at MW 350 kDa, 280 kDa and 85 kDa (for healthy rats), and protein bands at MW 170 kDa, 51 kDa and 46 kDa (for diabetic rats). In addition, the differentially excreted proteins at MW 62 kDa and 25 kDa (between healthy and diabetic rats) could also be used as indicators. Using the unique band indicators, the pre-diabetic urinary profile was shown to be similar to that of healthy rats. However, by using the differential protein indicators, the band intensity of the 62 kDa, 25 kDa and 17 kDa bands of pre-diabetic rats, with normal diet and metformin treatment, was more similar to that of the healthy rats with normal diet. However, the profile of pre-diabetic rats with high fat diet (with or without metformin treatment) and of pre-diabetic rats (with normal diet without metformin treatment) were more similar to that of diabetic rats.
Conclusion: Using this protein profiling comparison method, it was demonstrated that early metformin treatment and controlled diet intake are important in delaying the progression of the pre-diabetic to diabetic state.

Downloads
Published
Issue
Section
License
Copyright The Author(s) 2017. This article is published with open access by BioMedPress. This article is distributed under the terms of the Creative Commons Attribution License (CC-BY 4.0) which permits any use, distribution, and reproduction in any medium, provided the original author(s) and the source are credited.
